>ƒFinForge

For those who respect fundamentals

FinForge

Raw data in. Clear answers out.

FinForge puts all your financial information in one workspace and plugs it straight into Excel. Build your own models, run deep fundamental analysis, and customize every calculation, without writing a line of code.


Statements3per ticker
Features19in one workspace
Setup file1setup.bat

Features

Ingest, Analyze, Deliver.

A plain-English tour of everything FinForge can do.

  1. 01IngestPrices and company fundamentals are pulled in automatically from the market.
    • Live Market DataPrices and company fundamentals are pulled in automatically from the market.
    • Pick What You ImportChoose exactly which line items appear in your workbook, from any of the three statements.
    • Find Research FastSearch for equity research and analyst notes without leaving the app.
    • Track Multiple StocksFollow and compare as many companies as you want, all in one place.
    • Macro RatesCentral-bank policy rates and treasury yields are fetched and charted alongside your stocks.
  2. 02AnalyzeZoomable charts compare multiple stocks and ratios side by side, with dual axes and range sliders.
    • Interactive ChartsZoomable charts compare multiple stocks and ratios side by side, with dual axes and range sliders.
    • Build Your Own FormulasBuild custom financial ratios in a visual builder, no coding required.
    • Ranking DashboardScore and rank companies against your own weighted metrics, with a curve you shape by hand.
    • Company SnapshotsA clean summary of the key details for any company you follow.
    • DCF ValuationValue a company with a two-stage discounted cash flow model built from its own financials.
  3. 03DeliverAn interactive dashboard built right into the spreadsheet you already know.
    • Works in ExcelAn interactive dashboard built right into the spreadsheet you already know.
    • Save Your SetupReuse saved workbook templates so you never start from scratch.
    • One Click from ExcelLaunch the full workspace straight from the Excel ribbon.
    • Your Metrics in ExcelSave a metric once and call it from any cell as a live Excel function, for example =FF("Price to Book", "AAPL").
    • Share Your SetupExport your metrics and presets as one file, and import someone else's the same way.
  4. 04Under the hoodThe workspace stays quick no matter how large your library grows.
    • Fast and ResponsiveThe workspace stays quick no matter how large your library grows.
    • Clean Desktop AppA modern workspace with search, charts, and tools in one simple sidebar.
    • Organize Your MetricsGroup metrics into folders so a large library stays easy to navigate.
    • Automatic Data CleanupRemoved tickers are scheduled and their data is cleared for you after a grace period.
  • Live Market DataPrices and company fundamentals are pulled in automatically from the market.
  • Pick What You ImportChoose exactly which line items appear in your workbook, from any of the three statements.
  • Find Research FastSearch for equity research and analyst notes without leaving the app.
  • Track Multiple StocksFollow and compare as many companies as you want, all in one place.
  • Macro RatesCentral-bank policy rates and treasury yields are fetched and charted alongside your stocks.
  • Interactive ChartsZoomable charts compare multiple stocks and ratios side by side, with dual axes and range sliders.
  • Build Your Own FormulasBuild custom financial ratios in a visual builder, no coding required.
  • Ranking DashboardScore and rank companies against your own weighted metrics, with a curve you shape by hand.
  • Company SnapshotsA clean summary of the key details for any company you follow.
  • DCF ValuationValue a company with a two-stage discounted cash flow model built from its own financials.
  • Works in ExcelAn interactive dashboard built right into the spreadsheet you already know.
  • Save Your SetupReuse saved workbook templates so you never start from scratch.
  • One Click from ExcelLaunch the full workspace straight from the Excel ribbon.
  • Your Metrics in ExcelSave a metric once and call it from any cell as a live Excel function, for example =FF("Price to Book", "AAPL").
  • Share Your SetupExport your metrics and presets as one file, and import someone else's the same way.
  • Fast and ResponsiveThe workspace stays quick no matter how large your library grows.
  • Clean Desktop AppA modern workspace with search, charts, and tools in one simple sidebar.
  • Organize Your MetricsGroup metrics into folders so a large library stays easy to navigate.
  • Automatic Data CleanupRemoved tickers are scheduled and their data is cleared for you after a grace period.

Why FinForge

Everything runs locally

The application runs locally on your computer, and your financial data never leaves it.

01 · Local

Clean Desktop App

A modern workspace with search, charts, and tools in one simple sidebar. Everything runs locally on your machine, with nothing to upload.

02 · Scalable

Track Multiple Stocks

Follow and compare as many companies as you want, all in one place. The same workspace, the same metrics and the same charts work for every ticker you add.

03 · Customizable

Build Your Own Formulas

Build custom financial ratios in a visual builder, no coding required. Combine the line items you imported, then save the result as a metric you can reuse anywhere.

04 · Fast

Fast and Responsive

The workspace stays quick no matter how large your library grows. Follow a handful of companies or hundreds, and loading a company, drawing a chart or searching keeps up with you.


Data sources

Every data source in one workspace

Market data, statements, filings, metadata, insider activity, and analyst estimates are pulled in automatically and stored on your computer, ready for any model you build.
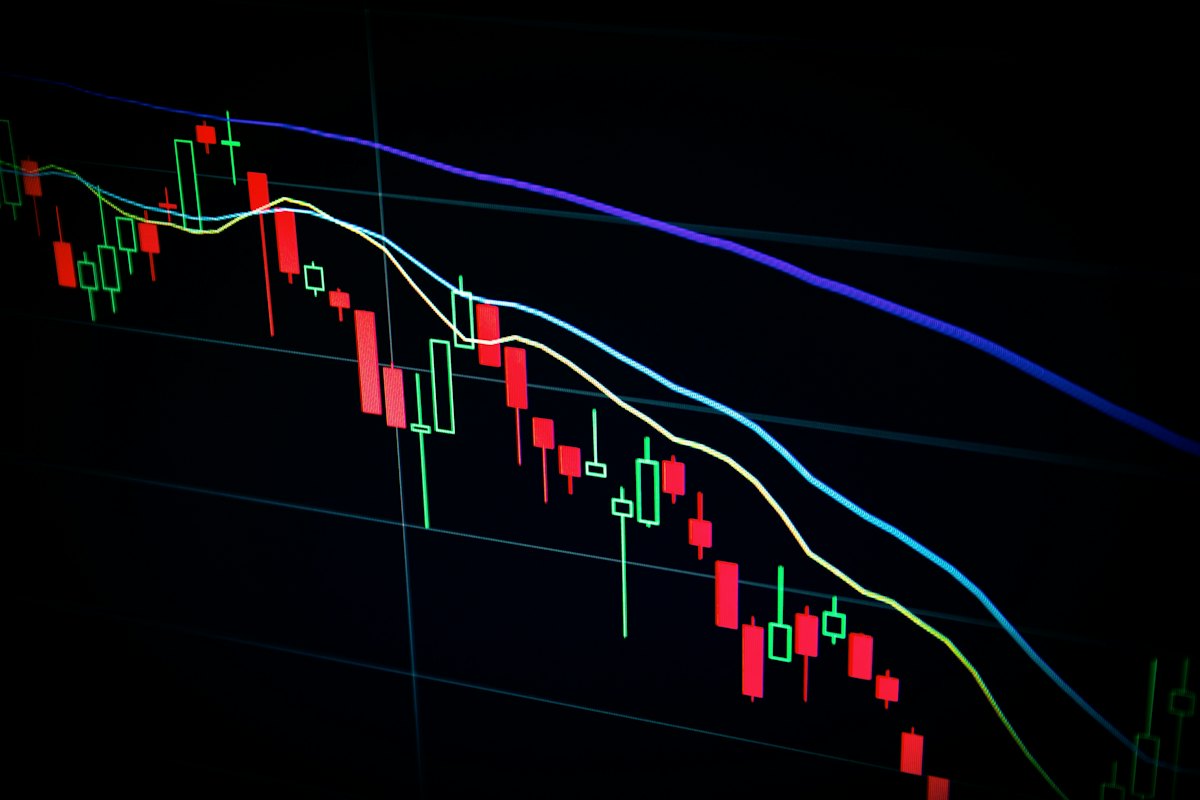

  • A trading screen showing candlestick charts and moving averages.

    Market data

    live

    prices and fundamentals

    Live prices and company fundamentals, pulled in from the market.

  • Two people reviewing printed charts and documents at a desk.

    Financial statements

    3

    statements per ticker

    Income statement, balance sheet, and cash flow, imported line by line.

  • Paper financial forms spread out with a calculator and a pen.

    SEC filings

    10-K

    plus every other filing

    Recent filing links and metadata, fetched per ticker.

  • A low-angle view of modern skyscrapers against an overcast sky.

    Company metadata

    1

    profile per company

    Sector, industry, employees, and the key facts behind every ticker.

  • A business handshake between two people in dress shirts.

    Insider activity

    trades

    who bought, who sold

    Insider transactions, purchase summaries, and the roster of holders.

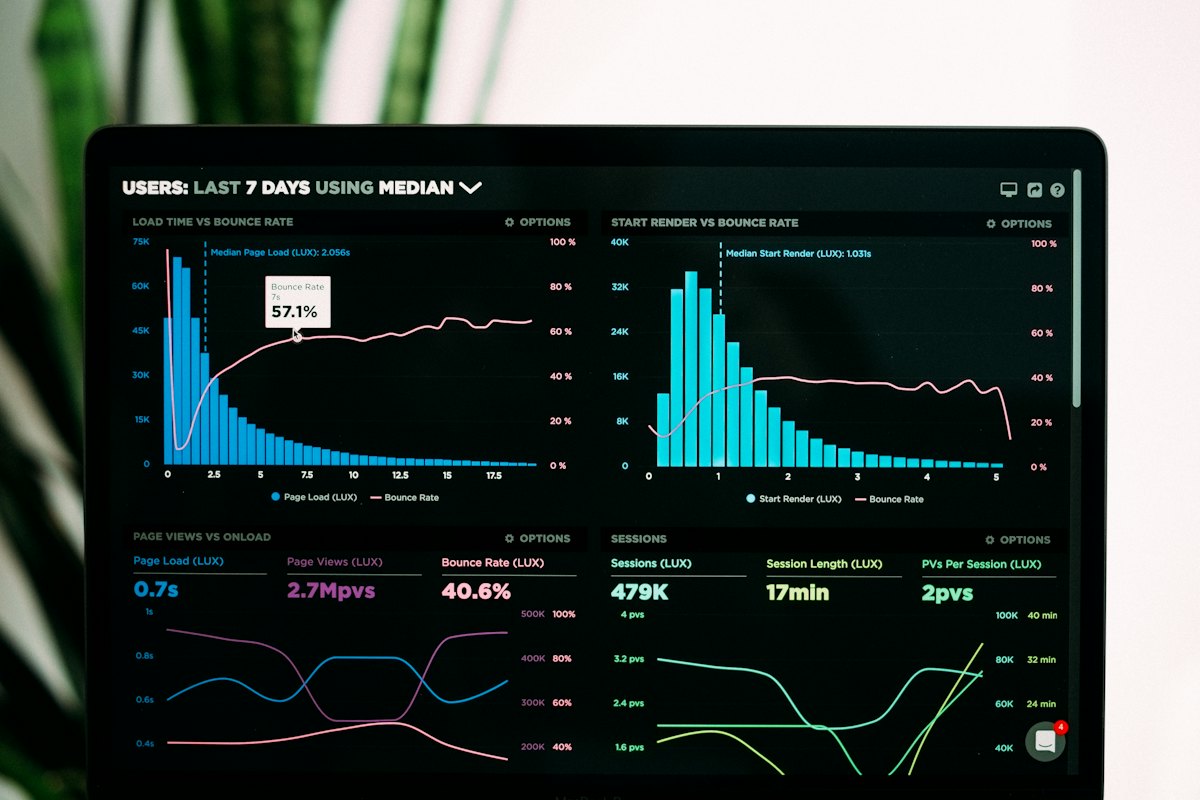
  • A laptop showing an analytics dashboard with charts and graphs.

    Analyst estimates

    targets

    earnings to price targets

    Earnings and revenue forecasts, price targets, growth, and recommendations.

  • A dimly lit library aisle with bookshelves and hanging light bulbs.

    Research search

    search

    equity research, in-app

    Search equity research and analyst notes without leaving the app.

  • Classical government-style stone buildings with columns and domes.

    Central banks

    rates

    policy rates and treasury yields

    Policy rates and treasury yields, charted next to your stocks. Seeds the DCF risk-free rate.


Get started

Start with raw data. End with clear answers.

No coding required

Download the project. Run setup.bat. Launch.

Raw data in. Clear answers out. FinForge is under active development and keeps improving.

  1. ✓Download
  2. ✓Run setup.bat
  3. 3Launch — open your dashboard

FinForge is a tool for organizing and analyzing market data, not financial advice. Always do your own research before making investment decisions.Read the full disclaimer.